


myGemma, the nation’s leading online buyer and partner for retailer buy-back of diamonds , jewelry and watches, is excited to announce the launch of America’s Diamond and Jewelry Ranking. The company’s last 15,000 consumer inquiries and data have informed these findings, covering all 50 states.
America’s Diamond and Jewelry Ranking is the first report of its kind that directly analyzes ownership across the United States.
- Click here to see where America’s most valuable diamonds are coming from
- Click here to see which states have the biggest diamonds
- Click here to see which states own the most valuable secondhand jewelry
- Click here to see which diamond shapes are the most popular in which states
- Click here to see what the most popular diamond shapes in America are
Although plenty of reports have been issued by authorities regarding the mine-to-market process, rough diamonds, bridal and retail sales statistics, this is the first report that analyzes data based on what consumers already own. State-by-state, a feel for diamond and jewelry preferences and taste can be deduced, with surprising results.
Answering an important question for the diamond-curious and jewelry enthusiasts across America…where does your state rank?
<3>Quality Not Quantity The Diamond Index is a Quality Indicator of Diamonds by State,
with the states in Gold expressing the highest average value per carat of diamond.

- New York
- Florida
- California
- Connecticut
- Maryland
- New Jersey
- Massachusetts
- Kansas
- Tennessee
- Colorado

- Washington
- Hawaii
- Alaska
- Oregon
- Arizona
- Texas
- North Carolina
- New Hampshire
- South Dakota
- Georgia

- Missouri
- Illinois
- Virginia
- Pennsylvania
- Arkansas
- Nevada
- Rhode Island
- Oklahoma
- Louisiana
- Wisconsin

- Alabama
- Michigan
- Ohio
- Idaho
- Delaware
- South Carolina
- Wyoming
- Indiana
- Kentucky
- Utah

- Minnesota
- Mississippi
- Montana
- Maine
- Vermont
- New Mexico
- West Virginia
- Nebraska
- Iowa
- North Dakota
Size Matters
Which states have the biggest diamonds?
These are the top ten states, in order, that have the largest diamonds. Data analyzed
includes loose stones, rings, as well as jewelry, with only the largest diamond per piece
being compared for data. The number listed is the average carat size for each top ten state.
- 1. Maryland at 1.75 ct.
- 2. Michigan at 1.69 ct.
- 3. Illinois at 1.59 ct.
- 4. Alaska at 1.49 ct.
- 5. New York at 1.47 ct.
- 6. Texas at 1.47 ct.
- 7. Florida at 1.47 ct.
- 8. Virginia at 1.44 ct.
- 9. Arkansas at 1.41 ct.
- 10. California at 1.40 ct.
Average Carat Size
Diamonds draw to scaleClick here to see how each state ranks.
Pre-own it
which states have the most expensive secondhand jewelry?
Because the data surveyed by myGemma reflects those looking to sell their diamonds and fine jewelry, it is an outstanding indicator of values across states for secondhand jewelry pricing.
The ten states listed show which states have the highest average secondhand jewelry values.
- California
- Florida
- North Dakota*
- North Carolina
- New Mexico*
- New Jersey
- Rhode Island*
- Connecticut
- South Dakota*
- Arizona
Highest Value per Jewelry Item
* Number of inquiries less than 0.5% of total
Click here to see how each state ranks.
USA Trendsetting
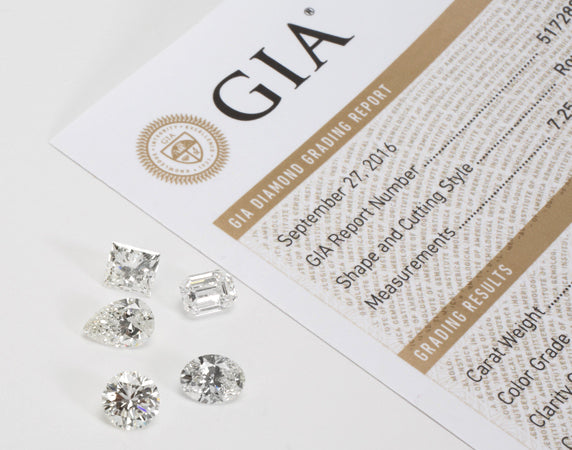
Where is each diamond shape the most popular?
With so many fabulous cuts for diamonds available, it is interesting to see which cuts
appeal to different states. Nine diamonds shapes are shown below,
followed by a list of the top five states where each is most popular.
RADIANT
ROUND
PRINCESS
CUSHION
EMERALD
HEART
MARQUISE
OVAL
PEAR